The Local Lowdown — Miami-Dade, Broward, and Orange Counties
Quick Take:
The Florida housing market remains one of the strongest in the country despite some price declines over the summer months.
Sales rose in August as new listings declined, dropping inventory and likely marking 2022 inventory as one of the lowest on record.
Months of Supply Inventory indicates a sellers’ market in Broward and Orange counties, while Miami-Dade is shifting toward a buyers’ market.
Note: You can find the charts/graphs for the Local Lowdown at the end of this section.
What about price growth?!
Prices tend to stagnate or decline slightly this time of year, which is exactly the case in the selected Florida counties. With the exception of Orange County condo prices, which reached an all-time high in August, the median single-family home and condo prices have declined off their peaks reached earlier this year, which isn’t unexpected, as we are returning to more normal seasonal price trends of growth in the first half of the year and slight contraction in the second half. This is, of course, exacerbated by rising mortgage rates. Although the current average 30-year mortgage rate of 5.66% is still historically low, the hyper-low rates we experienced in 2020 and 2021 allowed many more buyers to enter the market. We saw firsthand what happens when demand booms in an already undersupplied market: Home prices skyrocketed. However, when we link the price increases and seasonal trends with the 2.5% increase in 30-year mortgage rates, which increase the monthly mortgage payment by about 35%, we get a better picture of why sales have slowed and prices declined.
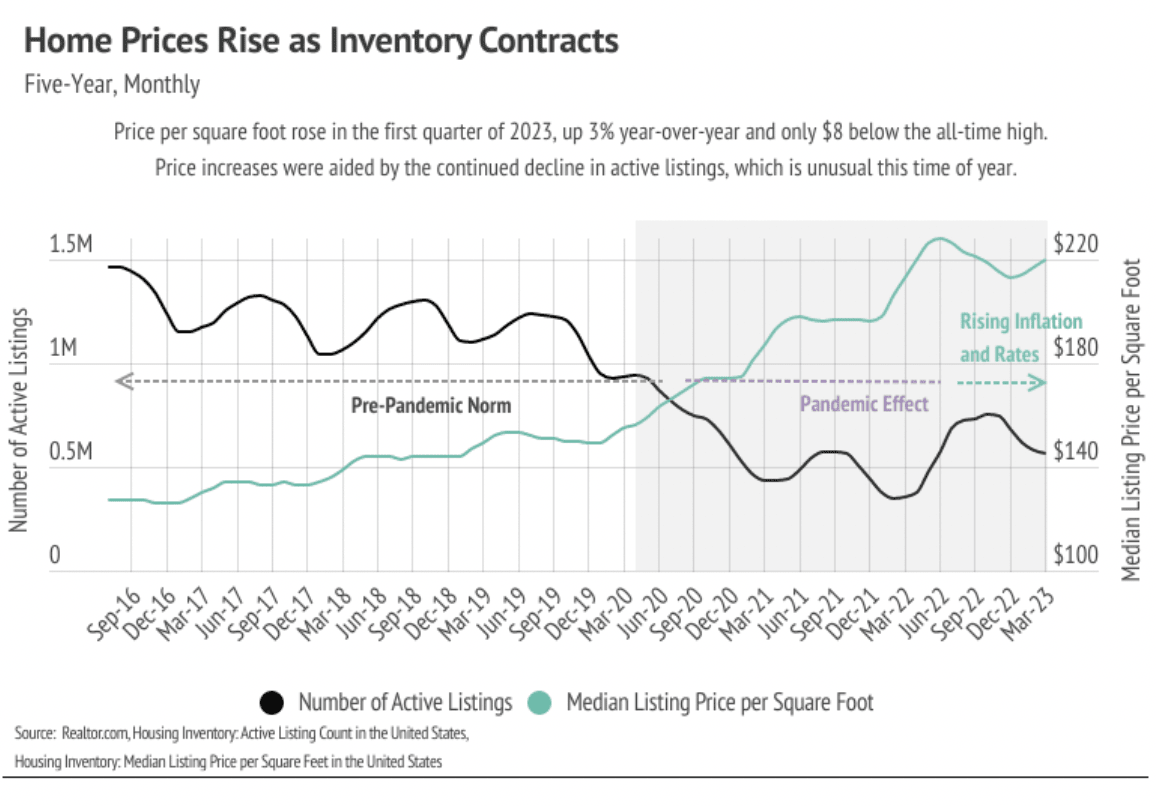
Inventory Remains Historically Low
Single-family home and condo sales declined month-over-month, along with new listings, keeping inventory historically low. The number of homes for sale has trended lower over the past three years and settled at lower levels, which is likely the new normal for housing inventory in the country. Generally, smaller supply equates to fewer sales. For example, if 500 homes sold last year, but there are only 300 homes for sale on the market this year, it’s awfully difficult to hit more than 300 sales. With the drop in inventory, the peak inventory levels for 2022 will undoubtedly be the lowest on record.
Additionally, the huge number of sales in 2021 implies a sales slowdown in the future, and the future is now. On average, people move about 12 times in their lifetime in the United States, meaning if a million more people than average buy a home one year, there’s a decent chance about a million fewer people will buy a home the next. Homes are generally not something people continuously buy year after year.
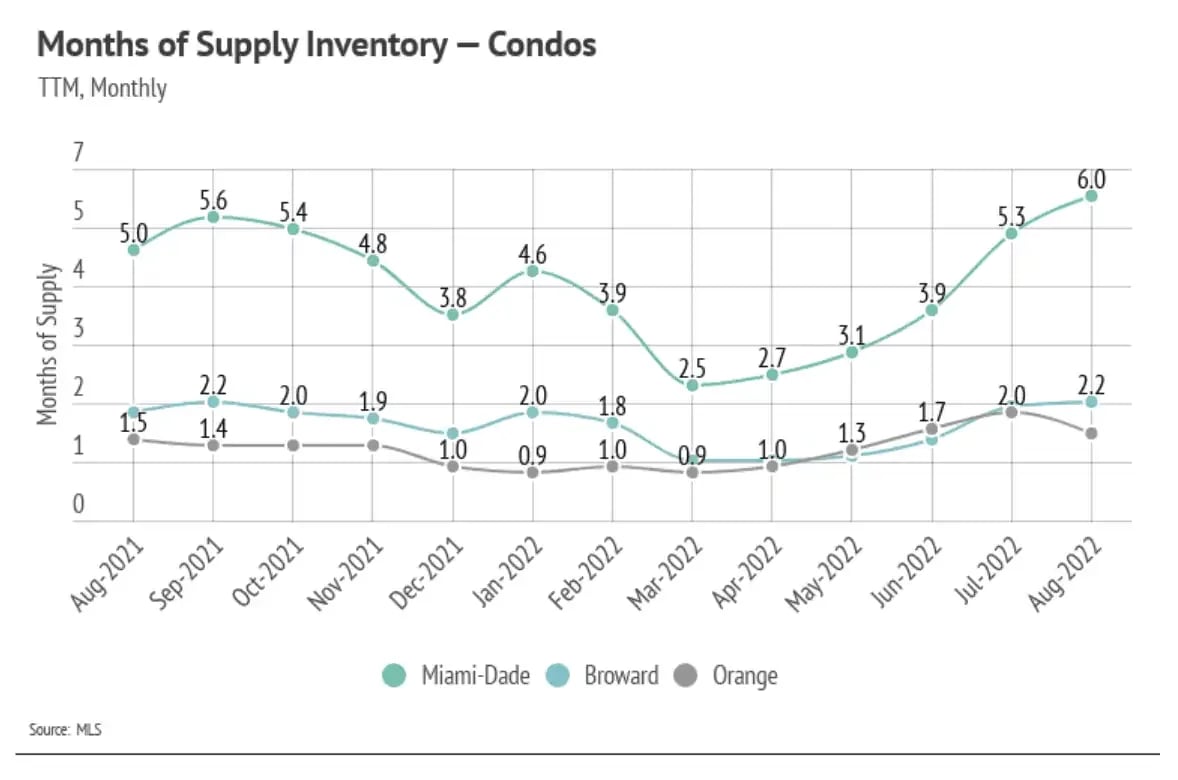
Months of Supply Inventory Declined, Implying a Sellers’ Market
Months of Supply Inventory (MSI) quantifies the supply/demand relationship by measuring how many months it would take for all current homes listed on the market to sell at the current rate of sales. The long-term average MSI is around four to five months in Florida, which indicates a balanced market. An MSI lower than four indicates that there are more buyers than sellers on the market (meaning it’s a sellers’ market), while a higher MSI indicates there are more sellers than buyers (meaning it’s a buyers’ market). In August, single-family home and condo MSIs are low, indicating a sellers’ market, with the exception of Miami-Dade, which has moved toward balanced for single-family homes and a buyers’ market for condos.